Increasingly frequent and destructive floods leave a lasting mark on territories and on people. They stand out as the natural hazard accounting for the highest number of activations within the emergency mapping program – Copernicus Emergency Management Service – Rapid Mapping (CEMS RM) (Maxant, J. et al., 2022).
To meet the needs of risk and crisis management stakeholders, SERTIT provides geoinformation derived from satellite imagery within a short timeframe. However, whether optical or radar-based, this imagery presents limitations, particularly in certain environments, and more specifically in urban areas. Yet these spaces concentrate both economic and human vulnerabilities, thereby increasing the associated risk (Fujiki, K., & Finance, O., 2022). To overcome these detection gaps, hydraulic modelling tools are employed. Since 2023, SERTIT has been leading a project to develop a methodology combining 2D hydraulic modelling and satellite imagery to define flood extents and estimate flood depths.
This study is part of the FUSION project, supported by the European cross-border cooperation program INTERREG France-Wallonie-Vlaanderen. This program aims to strengthen coordination, promote a shared balance, and ensure sustainable water management within the transboundary Lys River basin.
Study Area and context
In January 2024, within the Lys river basin in northern France, the municipality of Merville experienced an exceptional flood: following record rainfall, the water level of the Lys rose to as much as 3 meters, exceeding the previous maximum recorded in 1999.
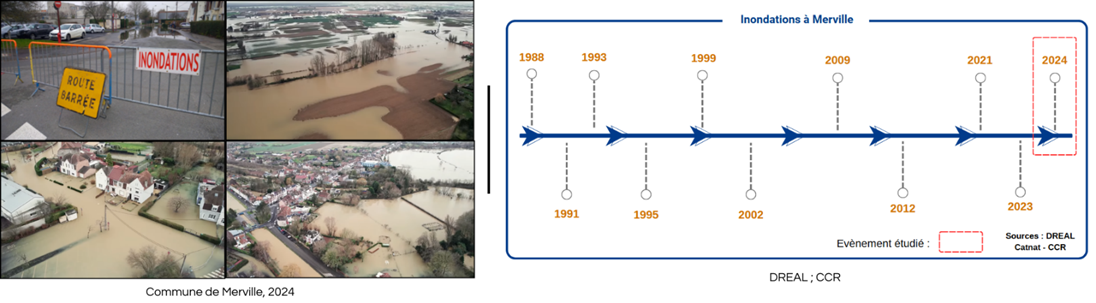
b. Major floods in Merville over the past 40 years
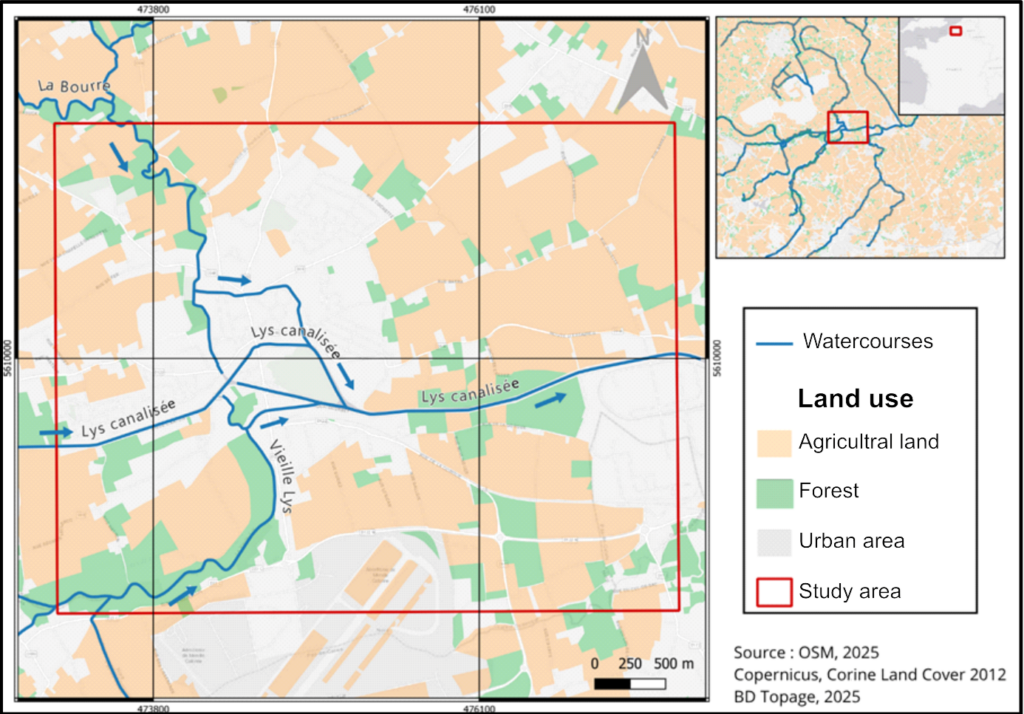
It is a frequently flooded area, characterized by its flat topography and the density of its hydrographic network, located at the confluence of the Bourre, the Vieille Lys, and the canalized Lys rivers. Land use in our study area is dominated by agricultural land (75%, primarily cereal crops), followed by urbanized areas (17%, including individual housing and industrial complexes), and, to a lesser extent, forested areas (8%).
Hydraulic modeling
Hydraulic models simulate the characteristics of a flood propagating along the entire river’s course of interest. To this end, we used the DassFlow2D and Telemac2D computational codes (Honnorat, M. et al., 2007; Pujol et al., 2022; Hervouet, J.-M., 1999), based on the 2D Saint-Venant equations. Flood extents derived from satellite imagery, as well as field data (flood traces, drone video), were used for model calibration.
Evolution of water depth during the January 2024 flood event (30/12/2023–14/01/2024) – Telemac2D
The dynamics of the January 2024 flood in Merville were accurately reproduced by the model. The canalised Lys overflowed into the floodplain starting on 31 December, 2023. Overflows from the Vieille Lys and the Bourre increased the flooding on January 3 and 4. The maximum extent of the flooded areas, as well as the highest water depths, were reached between January 7 and 8. From 10 January 10 onwards, the flood abatement phase began: discharges gradually decreased, and the flooded areas started to recede.
Almost the entire urban centre of Merville, the hardest-hit area, was modelled as flooded, with water depths and extents similar to the validation data. It is in these same areas that a notable difference is observed between hydraulic modelling and satellite imagery. This can be seen below in the comparison between hydraulic modelling and satellite images on 05 January, 2024.
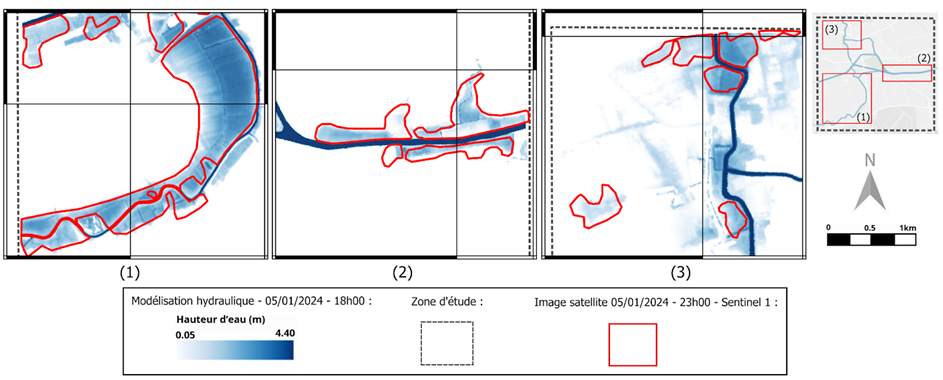
In areas where the signal is not disturbed by the presence of urban surfaces (images 1 and 2), there is a very good correspondence between the extent of the simulated water body and that extracted from satellite images. In contrast, in sector 3, corresponding to a residential area near the Bourre, the hydraulic modelling identifies a larger flooded area than that detected from satellite imagery. The degradation of the signal recorded by the satellite in these highly vulnerable areas makes water surface detection less reliable.
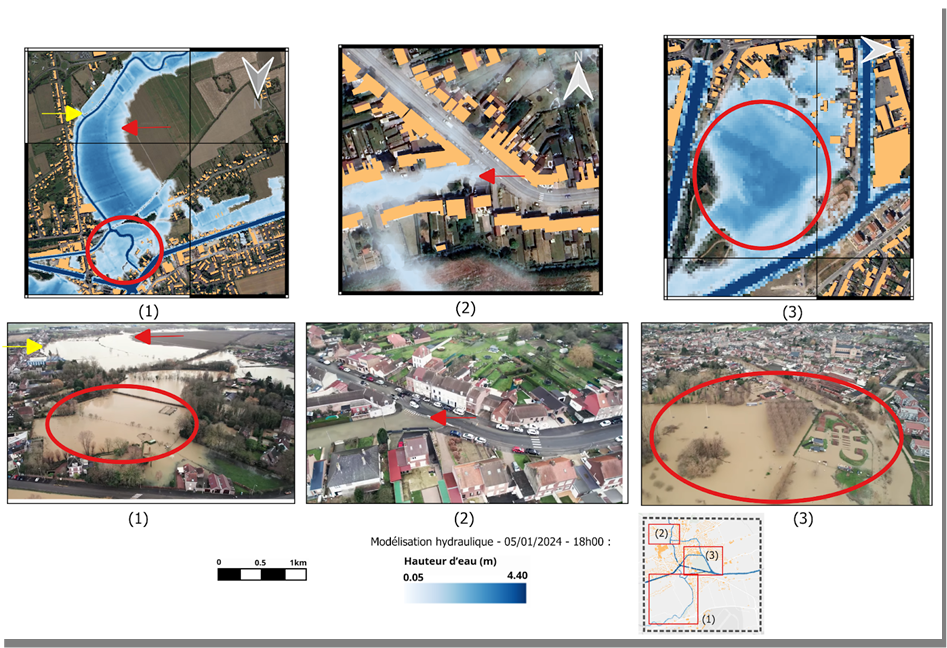
The comparison with the drone video from 05 January at 00:00 (Drone Video Merville, 2024) also shows a good agreement between the visible and simulated water bodies. This is particularly noticeable at Rue du Fer (2), where the flood front is located at the intersection with Route d’Hazebrouck.
Finally, the Jean-Marie-Lefevre area (3), a particularly impacted zone, is flooded both in the drone video and in our simulation to the same extent, with water depths reaching up to 2.50 m.
The implementation of a 2D hydraulic model made it possible to reproduce water depths and extents during the January 2024 flood in Merville. It also served to spatialise and quantify the limitations of satellite observation for extracting water surfaces in urban areas. Hydraulic modelling proved to be the primary working tool, while satellite imagery was used as validation and calibration data.
Hydraulic modeling is characterized by the precision of its results; however, the associated computation times are not yet compatible with rapid mapping requirements. To provide geoinformation derived from satellite imagery within tight deadlines, SERTIT utilizes Exflos (Poterek, Q. et al., 2025), a tool that couples satellite observations with 0D hydraulic modeling.
Bibliography
Fujiki, K., & Finance, O. (2022). Exposure and social vulnerability of French cities to flood risk: a fine-scale spatiotemporal analysis (1999–2017). Cybergeo: European Journal of Geography.
Hervouet, J. M. (1999). TELEMAC, a hydroinformatic system. La Houille Blanche, (3-4), 21–28.
Honnorat, M., Marin, J., Monnier, J., & Lai, X. (2007). Dassflow v1.0: a variational data assimilation software for 2D river flows (Doctoral dissertation, INRIA).
Maxant, J., Braun, R., Caspard, M., & Clandillon, S. (2022). ExtractEO, a pipeline for disaster extent mapping in the context of emergency management. Remote Sensing, 14(20), 5253.
Poterek, Q., Caretto, A., Braun, R., Clandillon, S., Huber, C., & Ceccato, P. (2025). INterpolated FLOod Surface (INFLOS), a Rapid and Operational Tool to Estimate Flood Depths from Earth Observation Data for Emergency Management. Remote Sensing, 17(2), 329.
Pujol, L., Garambois, P. A., & Monnier, J. (2022). Multi-dimensional hydrological–hydraulic model with variational data assimilation for river networks and floodplains. Geoscientific Model Development, 15(15), 6085–6113.
Ville de Merville. (2024, January 5). Floods – January 2024 [Video]. Facebook.
https://www.facebook.com/VilleMerville/videos/inondations-janvier-2024/929570278505909