Wildfires have grown increasingly prevalent, causing significant socio-economic and environmental damage. As a result, the emphasis on efficient detection and delineation of fire events has driven the development of novel methodologies and techniques over the years. Reflecting this trend, SERTIT’s intern, Oscar Narvaez worked on an exploratory project during summer 2023, aiming to assess the potential and applicability of Unsupervised Deep Learning methods for wildfire delineation with VHR SPOT imagery.
Methodology pursued and dataset used
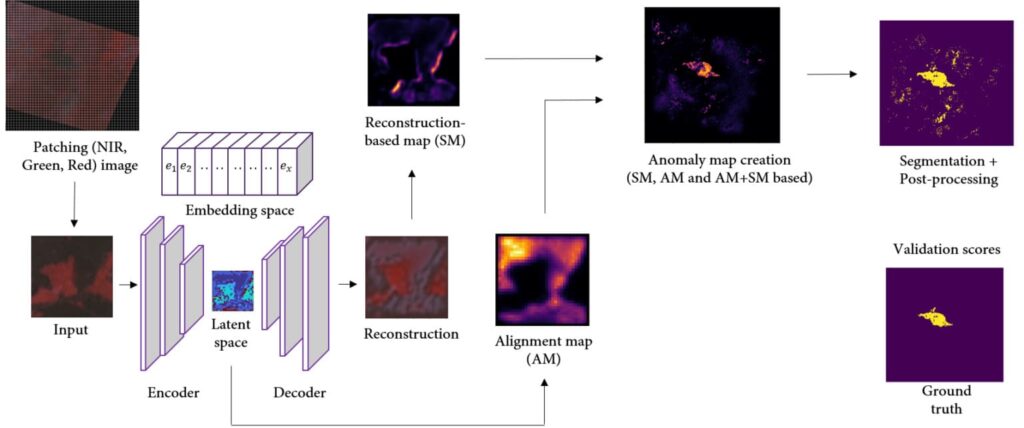
Unsupervised methods are commonly used in academic literature to detect anomalies. In partnership with the IRISA/OBELIX team, and taking cues from the research of Gangloff et al. (2022) on anomaly detection, we leveraged Vector-Quantized Variational Autoencoders (VQ-VAE). While VQ-VAEs are usually employed for image reconstruction, they hold potential in anomaly detection as well. Specifically, when the model is trained on pre-crisis images devoid of any visible wildfire, the reconstruction of post-crisis images showcasing evident burnt areas will showcase poor quality. This is because these post-crisis images don’t align with the model’s learned distribution. Consequently, pixels corresponding to burnt areas stand out as outliers, making them easier to detect.
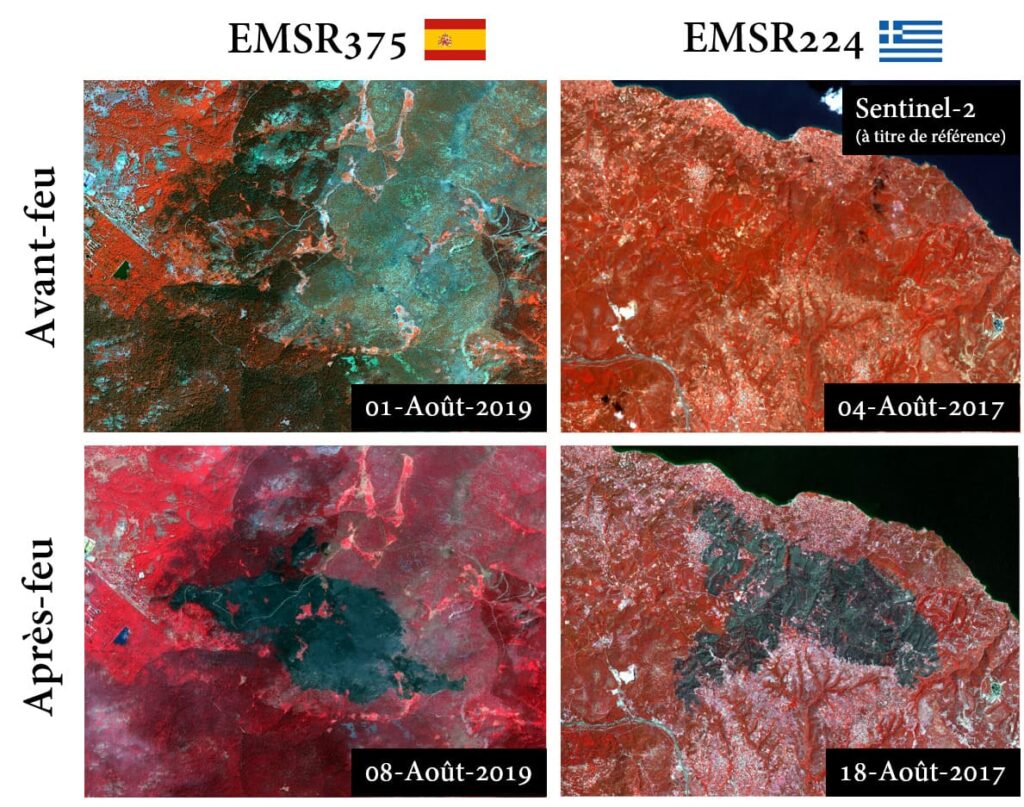
The dataset was provided by SERTIT based on SPOT-6/7 imagery from the Copernicus fire activations EMSR375 in Segovia, Spain and EMSR224 in Kalamos, Greece; and a 3-band stack (NIR, Red, Green) was used for training and testing with the exception of the pre-event image from EMSR224 which was not available. A single image from the EMSR375 region prior to the incident was used to train the model, later tested against post-crisis images from EMSR375 and EMSR224. Validation of the results was undertaken using the event delineation data available on the Copernicus Emergency Management Service (CEMS) website.
To generate the anomaly maps, we combined the outputs from the encoder in the latent space (Alignment map “AM”) with the output of the decoder (Reconstruction-based map “SM”), from this, a comprehensive anomaly map was computed. Later, the anomaly values were thresholded using a ROC curve and available reference data, to delineate anomalous areas.
Delineation results and conclusions
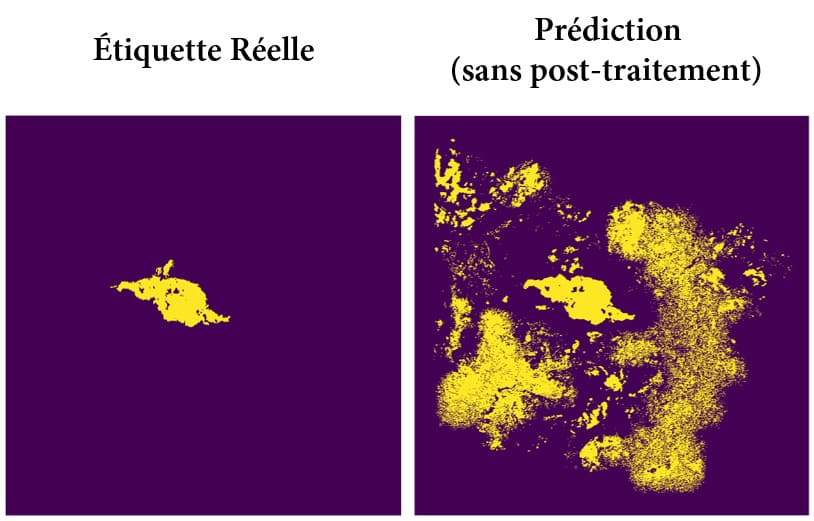
The findings from this study revealed that the model by itself was not able to exclusively delineate burnt areas. Indeed, it included numerous features from the post-crisis image, such as fine urban infrastructures and bare rocks. To refine the results, a post-processing approach was proposed in order to filter out of these false positives, while keeping burnt areas. This post-processing included three masks, namely the Normalized Difference Vegetation Index (NDVI), Normalized Difference Water Index (NDWI) and Landsat-based Brightness Index (BITM). Subsequently, sieving was employed to retain larger polygons associated with the burnt areas.
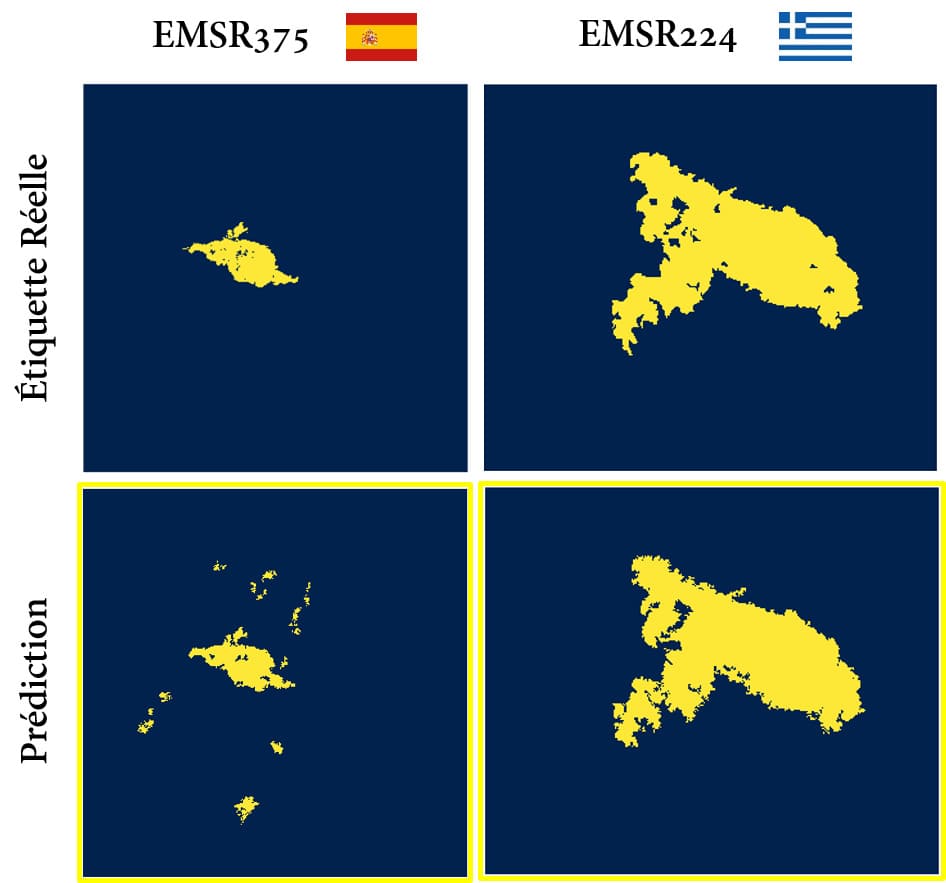
After performing the post-processing pipeline, the delineation of the burnt region improved significantly, aligning more closely with the True label. This additional step led to a more effective prediction of the wildfire event. However, the method’s versatility remains a challenge, particularly its applicability across different regions and sensors. When the same model was tested on another activations using both SPOT-6/7 and Pléiades images, it displayed inconsistent reliability in delineating burnt areas. Additional fine-tuning is thus required, especially on the thresholds for anomalous values masks derived from spectral indexes. Nevertheless, such outcomes were anticipated, as they are part of the inherent limitations of anomaly detection methods due to the large range of possible anomalies present in a satellite image.
For more information about the method, results and scores, please refer to the pre-print version of the article presented at the MACLEAN workshop during the ECML PKDD 2023 in Turin Italy.
Additional note
Readers may note discrepancies between the inference process diagram (Figure 2) in this blog post and the linked article. The linked piece portrays the results of the project up to June 2023. Since then, improvements were made by training the model on 4 bands (Red, Green, Blue, NIR) model, using of the reconstruction-based map (SM), and introducing sieving as an additional post-processing step. These enhancements resulted in a more accurate delineation, as shown in Figure 4 of this article.
Further steps in this line of work should contemplate the use of an expanded dataset to refine the training and to obtain a more robust model, which considers greater diversity in land-cover and seasonal effects in addition of a fine-tuning of the model parameters.
References
Gangloff, H., Pham, M.T., Coutrai, L., Lefèvre, S. (2022). Leveraging vector-quantized variational autoencoder inner metrics for anomaly detection. In: 2022 26th Inter- national Conference on Pattern Recognition (ICPR), pp. 435–441.
Luces, O. D. R., Pham, M.T., Poterek, Q., Braun, R. (2023) Burnt area extraction from high-resolution satellite images based on anomaly detection. arXiv preprint arXiv:2308.13367.